BlogStock
Why your stock never matches your records
A stock discrepancy is rarely theft alone. Six real causes, and how to detect each one in your own records.
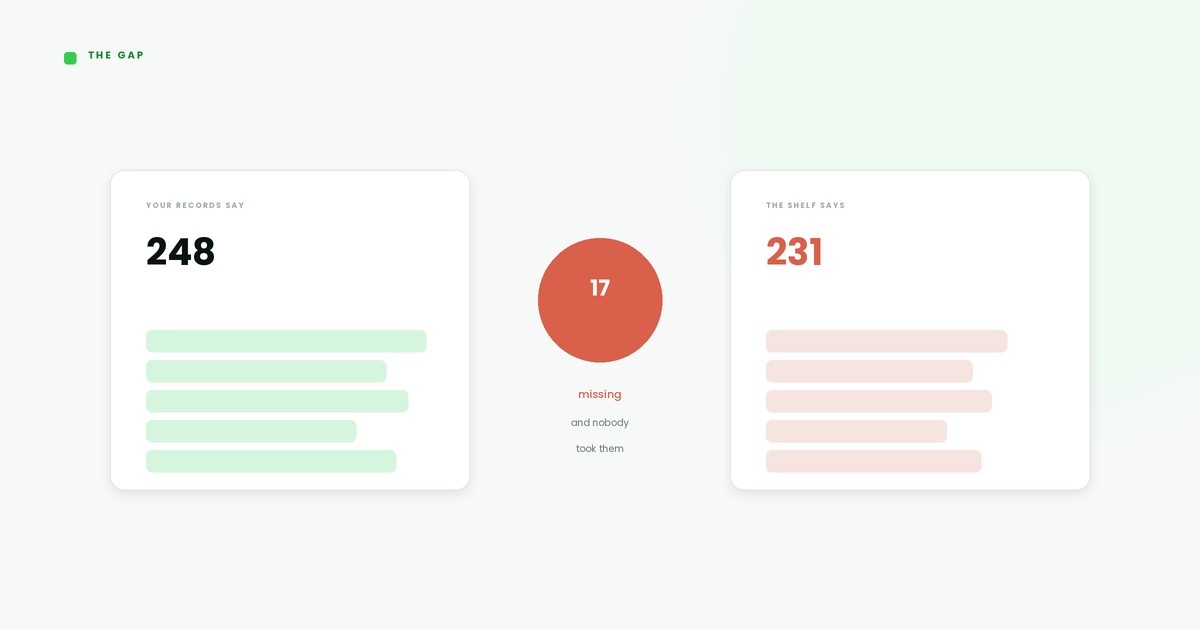
You counted 47 cartons of Peak milk. The system says 52. Nobody has an explanation, the room goes quiet, and everyone looks at the youngest person on the counter.
That is the worst possible place for this conversation to start. Five cartons is not evidence of anything yet. It is a number with six plausible parents, and only one of them is theft.
Here is how to tell them apart using records you already have.
Start by sizing it, not solving it
Convert the variance into money and into a percentage before you investigate anything. Five cartons at a cost of ₦12,000 each is ₦60,000 of stock you paid for and cannot see. That is an illustrative example, not a benchmark, but it decides how much time the problem deserves.
Variance % = (counted units − expected units) ÷ expected units × 100
Five short on 52 is 9.6%. Five short on 520 is under 1%. The first is a broken process. The second might be a rounding habit at the receiving door.
1. Receiving errors
The quantity on the delivery note is not always the quantity that reached your shelf. A driver is in a hurry, your storekeeper signs, and two cartons stay on the truck. Nobody lied. Nobody checked either.
How to detect it in the data: compare received against invoiced, delivery by delivery, then group the gaps by supplier. Work out a short delivery rate for each: deliveries with a variance divided by total deliveries. If one supplier sits at 3 in 10 while everyone else sits at 1 in 20, you have a supplier conversation, not a staff conversation.
The US National Retail Federation's security survey lists receiving errors among the named causes of retail shrink, alongside theft, damage and inaccurate counts. US data, but the list of causes travels.
2. Sales that were never recorded
Your boy at the counter sells a sachet of milk to a neighbour, drops the cash in the drawer, and never rings it up because six people are waiting. Repeat that eleven times a week and your fastest movers quietly go short.
How to detect it in the data: the signature is small shortages across many fast movers, concentrated in particular shifts. Pull sales per hour for the same weekday across four weeks and find the shift that consistently sells less than its neighbours. Then count voids and manual discounts per 100 transactions by user. One person at 9 voids per 100 when the shop average is 2 is a fact worth raising calmly.
A variance is a question about your process, not a verdict on your staff.
3. Transfers between shops
If you run two locations, this is usually the largest single cause and the least sinister. A carton moves from Surulere to Yaba on a Saturday because Yaba ran out, and the WhatsApp message that authorised it never became a record.
How to detect it in the data: run the net zero test. Add the variance for the same item across every location for the same period. If shop A is 6 short and shop B is 6 long, nothing left your business, only your records. A transfer needs both ends, the way a bank transfer does: sender, receiver, date, confirmation.
4. Damage and expiry
Breakage, leakage, rats, a carton dropped off a bike, and the yoghurt that timed out at the back of the fridge. This stock is genuinely gone. The question is whether it left a trail.
How to detect it in the data: you cannot detect what was never written down, so this one needs a habit first. Log every damaged or expired unit with a reason code as it goes in the bin, then measure damage as a share of units received per category. If 40 units out of 4,000 received are written off, that is 1%, and once you know your normal you can spot the month it doubles.
5. Returns handled the wrong way round
A customer brings back a blender. Your staff refund the cash and put the blender on the shelf without recording it as returned stock. Your records now show one blender fewer than you have. Process the refund twice instead and you get the mirror image.
How to detect it in the data: match the number of refunds to the number of stock-in movements tagged as returns. Those two numbers should be close. If you processed 30 refunds and stock only moved back in 11 times, you have found 19 mysteries. For scale, NRF and Happy Returns put US retail returns at $890 billion in 2024, roughly 16.9% of sales. That is US data, not Nigerian, but it shows returns are big enough to distort a count.
6. The same item living under two names
"Peak Milk 400g" and "Peak 400g tin" are one product and two records. Sales hit one, receiving hits the other, and both are wrong forever.
How to detect it in the data: filter for items holding stock with zero sales in 90 days sitting next to a near-identical item that sells daily. That combination is nearly always a duplicate rather than genuine dead stock. Merge them, keep one barcode, and make one person responsible for creating new items.
Reading the shape of a variance
| What the variance looks like | Most likely cause | Where to look first |
|---|---|---|
| One supplier's items short again and again | Receiving error or short delivery | Delivery notes against goods received, last 90 days |
| Whole cartons missing, clean round numbers | Unrecorded transfer | Transfer log and the other shop's count that week |
| Many items short by small amounts, one shift | Unrecorded sales | Sales per hour by shift, voids per user |
| Short in one shop, long in another | Transfer between shops | Net zero test across all locations |
| Only perishables and fragile packaging | Damage and expiry | Bin log, expiry dates, fridge temperature |
| Counted more than expected | Duplicate item names or double receiving | Item list for near-duplicates, receiving history |
Work the causes in order of cost
Recount blind first, without telling the counter the expected figure. Then transfers, because they are free to fix, then receiving, because your supplier may owe you goods, then returns, damage and duplicate names. Only when those five are clear should the conversation turn to the counter, and by then you have a shift and a time window rather than a suspicion.
Then write the reason code. A variance closed without a recorded reason will be back next month wearing the same face.
Frequently asked questions
How much stock variance is normal for a small shop?
There is no published Nigerian benchmark to hold yourself against, so measure your own for three months and use that as your baseline. The direction matters more than the level.
Should I count everything to find a discrepancy?
No. Count the item that is wrong, count it blind, and count its neighbours on the same shelf. A full stock count establishes truth across the whole shop, which is a different job.
My records are in a notebook. Can I still do this?
Partly. A notebook records what happened but cannot compare shifts, suppliers and locations quickly. All six causes are found by comparison, which is where paper runs out of road.
Is a variance always somebody's fault?
Rarely one person's. Process failures such as receiving errors, damage and inaccurate counts are a significant part of retail shrink in the US survey data, and the same failures exist in any shop that is busy.
See the six causes before they become an argument
Wayg keeps sales, stock, transfers and cash on one set of records, so a variance arrives with a time, a location and a movement history attached. Daily variance detection means you investigate five cartons on Tuesday rather than fifty at quarter end.
Get started freeThe free plan needs no card.
Sources: VNDLY: Inventory shrinkage statistics 2026 (compiling NRF National Retail Security Survey 2023) · Good Order Inventory: Inventory management statistics (compiling NRF and Happy Returns 2024)