BlogStock
Shrinkage: what it costs and the six places it hides
What shrinkage costs, how to measure your own rate instead of borrowing someone else's, and the six places it hides.
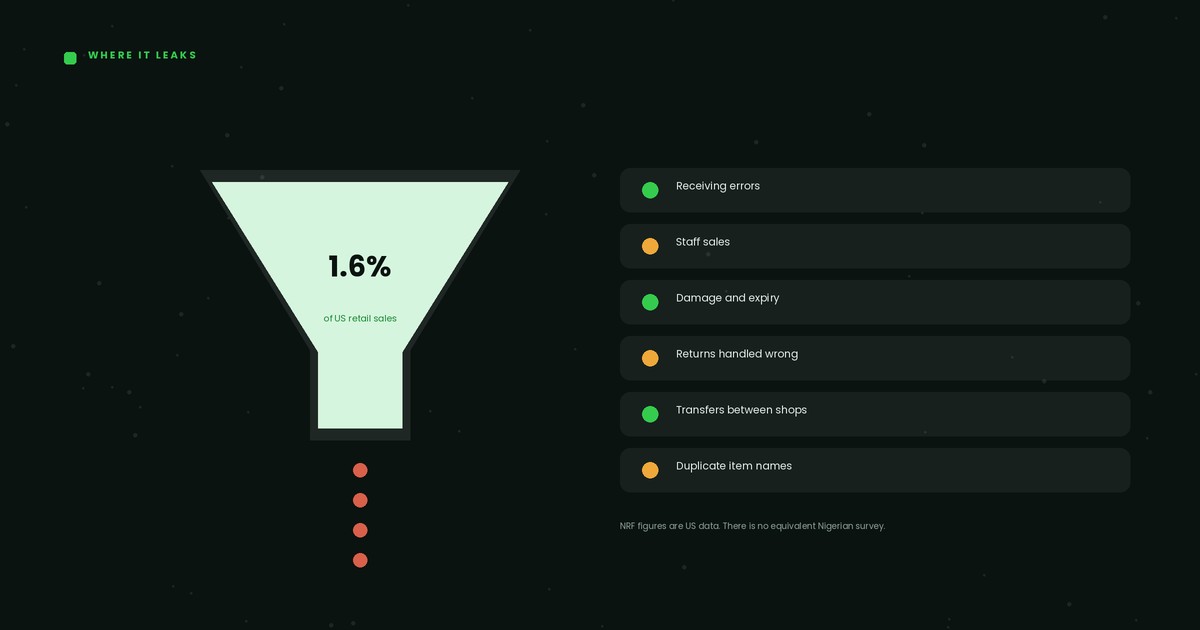
The National Retail Federation's National Retail Security Survey put retail shrink at 1.6% of retail sales in FY2022, up from 1.4% the year before. In money, that was $112.1 billion against $93.9 billion. Internal and external theft together made up close to two thirds of it.
Those are United States figures. They are not Nigerian figures, and nobody should quote them as if they were.
What they are good for is the shape of the problem: shrink is small as a percentage, enormous as a number, and mostly not a mystery once you look in the right six places.
There is no Nigerian version of this survey, so measure your own
Nobody publishes an equivalent national shrink benchmark for Nigerian retail. So treat 1.6% as the shape of the problem rather than your number, and spend one afternoon calculating your own.
Shrink rate = (value your records say you hold − value you actually counted) ÷ sales for the period × 100
Use cost values on both sides of the subtraction, and the same period for the count and the sales. You need one honest stock count to produce the counted figure, which is why the count and the shrink number are the same project.
Do it monthly for three months. The first number will annoy you. The third will be useful, because by then you know whether it is stable, rising, or sitting in one category.
What a shrink rate costs in naira
Illustrative example. The turnover and margin are made up to show the arithmetic, not researched benchmarks.
A shop turning over ₦6,000,000 a month, ₦72,000,000 a year, at a 25% gross margin.
| Shrink rate | Annual loss | Extra sales needed to earn it back |
|---|---|---|
| 0.5% | ₦360,000 | ₦1,440,000 |
| 1.0% | ₦720,000 | ₦2,880,000 |
| 1.6% | ₦1,152,000 | ₦4,608,000 |
| 2.5% | ₦1,800,000 | ₦7,200,000 |
The second column is the one that lands. Extra sales needed = annual shrink loss ÷ gross margin. At a 25% margin, every ₦1 lost to shrink takes ₦4 of additional sales to replace. Cutting shrink from 1.6% to 1.0% in this illustration is worth ₦432,000 a year, and costs nothing but process.
Every naira of shrink takes four naira of extra sales to replace. Shrink is the cheapest sales growth you will ever find.
The six places it hides
Globally, IHL Group estimated in 2025 that retailers lose around $1.7 trillion a year to inventory distortion. Again, global, not Nigerian. Here is where it actually sits in a shop.
1. The receiving door
Shrink often happens before the goods reach the shelf. A short delivery signed for without counting, a carton left on the truck, two invoiced and one received.
The control: nobody signs a delivery note they did not count. Count at the door, in the supplier's presence, against the purchase order and not the driver's word. Record goods received separately from invoiced, then track a short delivery rate per supplier. A supplier short three times in ten has a warehouse problem or a driver problem, and both become theirs to solve once you can show them the pattern.
2. The counter
Unrecorded sales, voided transactions, unauthorised discounts, and the drawer opened with no sale attached. Most of this is a busy queue, not a conspiracy, but the loss is identical either way.
The control: every sale gets a receipt, including sales to your own staff and your own family. Then measure by user rather than by feeling: voids per 100 transactions, discounts per 100 transactions, no-sale drawer opens per shift. Publish the averages so the outliers are visible. Add a cash count at shift handover with two signatures.
3. The back door and the untracked transfer
Stock leaves through doors that are not the front one. Sometimes that is theft. Far more often it is a carton sent to your other branch on a Saturday with nothing written down.
The control: make transfers two-sided, with a sender, a receiver, a date and a receiving confirmation, exactly like a bank transfer. Then run the net zero test across locations: if one shop is short 6 and another is long 6, nothing left the business. Keep the back door locked during trading hours.
4. The damage bin and the expiry date
Breakage, leakage, expiry, the fridge that lost light for nine hours. Real losses, usually undocumented, which means they surface later as a variance with no name.
The control: a damage log at the point of disposal, with a reason code and a value at cost. Measure damage as a share of units received per category, so you know your normal and can see the month it doubles. Run a weekly short-expiry report and discount before the date, not after. Anything that reaches expiry unsold was a dead stock problem two months earlier.
5. Returns and refunds
Refund the cash, forget to put the item back into stock, and your records understate what you hold. Process the refund twice and they overstate it. For scale, NRF and Happy Returns put US retail returns at $890 billion in 2024, about 16.9% of sales. US data, but it shows the volume returns can reach.
The control: a return is two movements, cash out and stock in, and both get recorded together. Require a receipt or a lookup of the original sale. Reconcile refund count to return stock movements weekly. If you processed 30 refunds and stock moved back 11 times, the gap is your answer.
6. The records themselves
The quietest hiding place. The same product under two names, adjustments never posted, a duplicated receipt, a sale recorded against the wrong item. No goods leave the building and your inventory is still wrong.
The control: one person creates new items, every item has one code, and the item list gets read end to end once a quarter for near-duplicates. Every adjustment carries a reason code and an approver above the person making it. In the Zebra Warehousing Vision Study in 2023, 80% of warehouse associates and decision makers said inaccurate inventory and out-of-stocks significantly challenge productivity, and 82% believed their systems needed improvement. Global data, but it names the same enemy.
The control sheet
| Hiding place | How it shows up | The control | Who checks, how often |
|---|---|---|---|
| Receiving door | One supplier short repeatedly | Count at the door against the PO | Storekeeper daily, owner monthly by supplier |
| The counter | Small shortages, one shift | Receipt for every sale, void and discount tracking | Manager per shift, owner weekly by user |
| Back door and transfers | Short here, long there | Two-sided transfers with confirmation | Owner weekly, net zero test |
| Damage and expiry | Perishables and fragile lines only | Damage log with reason code and value | Daily log, weekly short-expiry report |
| Returns and refunds | Refund count above return stock count | Return recorded as cash out plus stock in | Weekly reconciliation |
| The records | Variance with no physical explanation | One item, one code, one creator, approved adjustments | Quarterly item list review |
Frequently asked questions
What is a normal inventory shrinkage rate?
The US National Retail Federation survey put retail shrink at 1.6% of sales in FY2022. There is no published Nigerian equivalent, so measure your own for three months and manage the trend rather than chase a foreign benchmark.
How do I calculate my shrink rate?
Take the stock value your records say you hold, subtract the value you actually counted, divide by sales for the same period, and multiply by 100. Both stock figures at cost.
Is most shrinkage theft?
In the US survey, internal and external theft together made up close to two thirds of shrink, with process and control failures a significant further contributor. In a small shop with thin paperwork the process share is usually larger, which is why you check the six causes of a variance before you suspect anyone.
Can I reduce shrinkage without installing cameras?
Yes, and cheaper. Counting at the receiving door, a receipt for every sale, two-sided transfers, a damage log and weekly cycle counts cost nothing but discipline.
Find your own shrink number instead of borrowing someone else's
Wayg keeps sales, stock, transfers, adjustments and cash on one set of records and runs variance detection daily, so a gap surfaces with a date, a location and a movement history attached. That turns shrinkage from an annual shock into a weekly, fixable number.
Get started freeThe free plan needs no card.
Sources: VNDLY: Inventory shrinkage statistics 2026 (compiling NRF National Retail Security Survey 2023) · Goods Order Inventory: Inventory management statistics